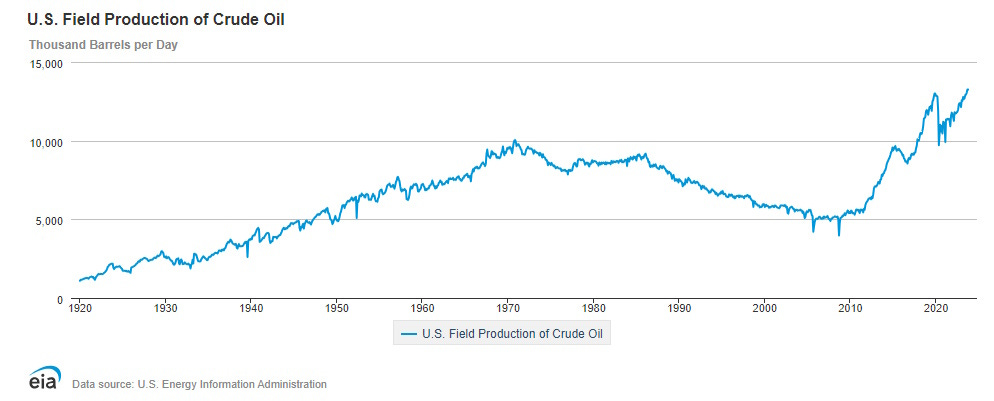
In October 2023 United States oil production reached more than 13,200,000 barrels per day, the most ever, and millions of barrels per day more than Saudi Arabia (about 9 million barrels a day in 2023) or Russia (10 to 10.5 million), the world’s next largest producers. This is probably the main factor keeping US gasoline prices around $3.10 a gallon (national average; the range is about $2.68 to $4.05 as of late December 2023).
The increase in US oil production began in 2008, when it was at a low point of 5,000,000 barrels per day. Apart from small declines in 2016 and for Covid in 2020-2021, the increase since 2008 has been steady, so that in October 2023 US production was more than 2½ times that of 2008.
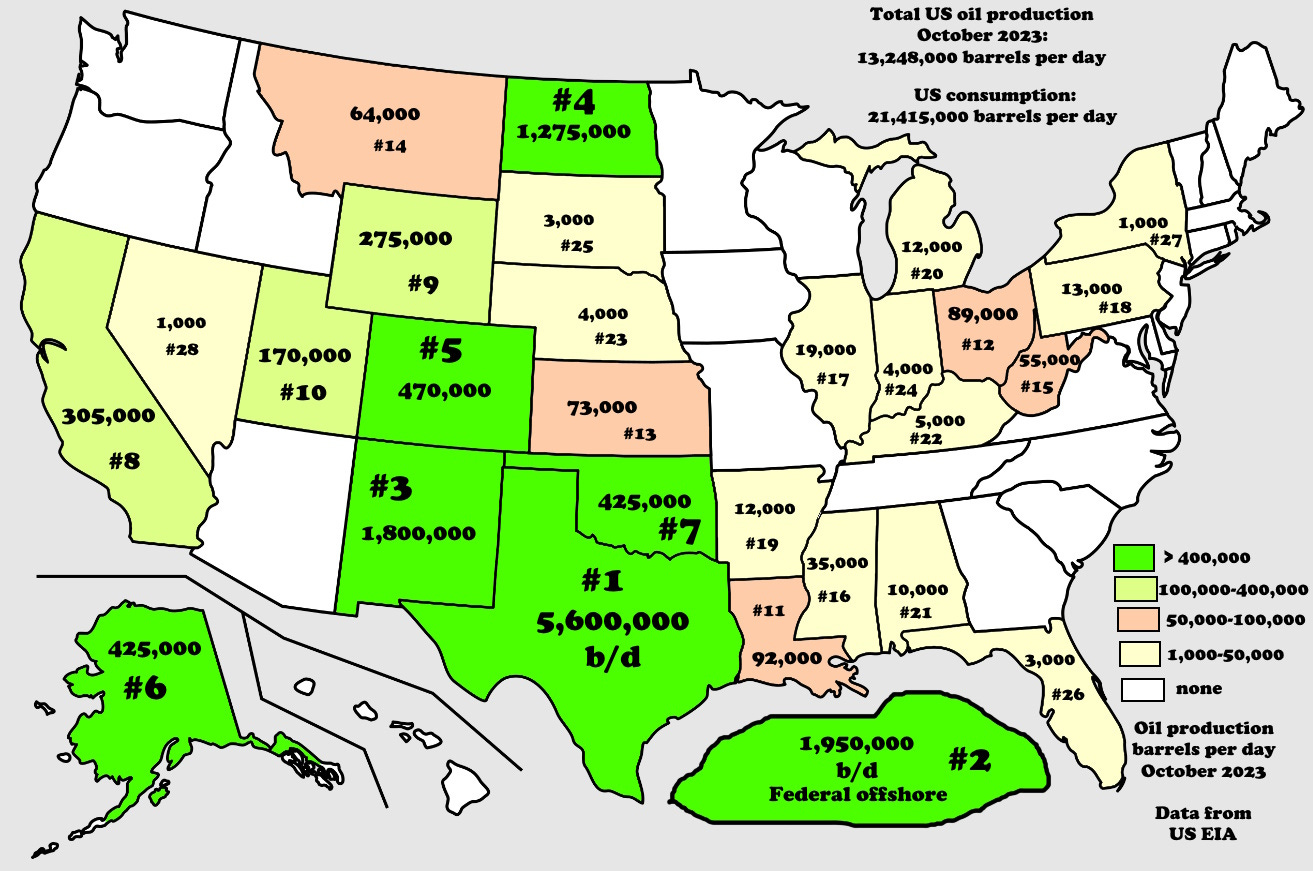
The surge began in 2008 largely because the Bakken oil play in North Dakota was taking off. I started the Bakken Formation Wikipedia page on November 12, 2007, just as production was coming on stream in significant quantities. Production has remained fairly consistent and keeps North Dakota at #4 in US state rankings for oil production, after Texas, the Federal Offshore Gulf of Mexico, and New Mexico. Besides the Bakken, dramatic increases in oil production in the Permian Basin of West Texas since 2010 have contributed significantly to the surge.
The ongoing production increase in 2022-2023 is probably also driven in part by price increases due to the Ukraine-Russia war, combined with renewed post-Covid demand worldwide. It takes many months to more than a year for such price changes to affect drilling and production rates. Since the price has fallen from highs around $117/barrel in May 2022 to a fairly consistent $75-$80 since about October 2022, and to around $70 today (Dec 31, 2023), production might decline somewhat in coming months. The drilling rig count in the US already fell by 20% in the 10 months from December 2022 to October 2023, to 501.
What ultimately happens with production will largely depend on demand in the US and on whether Saudi Arabia and Russia can maintain the production cuts they say they intend to observe, with the idea that decreased supply increases the price of oil. The high level of US production makes it much more difficult (but not impossible) for Saudi Arabia and Russia to influence the price significantly.
Here’s where that total 13,248,000 barrels per day of US oil production comes from, as of October 2023, by state (data from US Energy Information Administration). To answer the question I posed on Facebook, Montana ranks #14, after Wyoming and Kansas but ahead of Michigan.
Although my 49-year geological career was in oil exploration, I’ve collected minerals about 20 years longer than that, and since many of my readers are mineral collectors, here are four specimens with oil.
Left: Quartz, Herkimer, New York, with bits of ‘dead oil,” asphalt, also known as anthraxolite or pyrobitumen (#124). Right: Gypsum crystal impregnated with oil, Saudi Arabia (#135).
Left: Calcite, Rensselaer, Indiana. Brown part coated with oil (#1748). Right: Quartz, greenish liquid oil inclusions, Balochistan, Pakistan. The larger crystal is 17 mm high (#1140).
Despite all this production, the US remains the world’s largest oil consumer at 21,415,000 barrels per day (Dec. 2023), 22% of the world total for our 4.3% of the world’s population. China is the number two consumer, with 16% of the total and 18% of the population. Consequently, the US imports 6,276,000 barrels per day of crude, and 1,881,000 b/d of products.
As has been the case for decades, the greatest proportion of US crude oil imports comes from Canada, at 62% of total imports as of October 2023. Mexico is #2 with 12%, and Saudi Arabia and Iraq are distant third and fourth, at less than 4% of US imports each. The rest comes from 20 or so other countries in smaller proportions.
And the US exports oil as well: 3,900,000 b/d of crude, and products at 7,200,000 barrels/day.
Why export any crude? Why not keep it all? To a certain extent, we simply cannot process it. US refinery capacity, especially for the light oil much of the US produces, is inadequate. “Build more refineries?” Refining is historically about the lowest profit-margin sector in the oil industry. In 2009, US refineries operated at a net loss. That’s changed a lot with the oil price up to $117 in 2022, to as much as $20 per barrel profit or more at times, but it has fallen in 2023. The volatility in profit is one reason that companies are reluctant to invest the billions of dollars needed for a new refinery, not to mention fighting the not-in-my-backyard attitude, and not to mention the years required before such a new construction can come onstream and begin, slowly, to provide a return on the investment.
Another reason for exports is convenience. Historically, almost all US crude exports went to refineries in Canada near US producing fields, to return to the US as finished product like gasoline. Today, a significant portion of US products exports goes to Mexico because they have insufficient refinery capacity for their needs. The US imports Mexican crude, processes it, and sells the gasoline to Mexico. There’s profit all along the way, which is the point, as with any commodity.
US crude oil exports began to increase most dramatically in 2017, and following a covid-based decline, continue to rise today, to levels almost 17 times export volumes in 2014.
The nation taking the single largest bite of US crude oil exports is the Netherlands, at 21% of the total. The rest of Europe combined is even more, 24% of US crude exports. These exports to Europe are largely because they do not have adequate resources of their own, but often do have the refining capacity, and they are, generally speaking, trusted allies.
China and South Korea in near equal amounts together take 27%, and around a quarter of those exports to South Korea return to the US as finished products. Trade with China is certainly controversial on multiple levels, but obviously we want what they are selling: in 2022, the US imported goods worth $562.9 billion from China, while US exports to China were worth about $195 billion (source: Office of the US Trade Representative). Some US crude exports to China probably reflect a surplus of unrefinable oil (because of insufficient capacity for the types of oil available) produced in Alaska and California, cheaper to ship to China than to Europe.
Canada with 8% is another major US trading partner for crude oil, but as in the past much of that probably comes back to the US as refined product, especially gasoline. The rest of US crude exports go in small amounts to nations all over the world, especially Central and South America and southeast Asia. It’s all a juggling act for maximizing profit for everyone, while keeping consumer prices at tolerable levels. I’d say the definition of “tolerable levels” for the price of gasoline and other products is whatever the traffic will bear, such that demand does not decrease significantly. Demand (consumption) in the US in fall-winter 2023 is not quite at record high levels, but close. We are apparently “tolerating” the current price of gasoline easily.
Globalized trade for a commodity like oil is complicated, but pretty much does come down to global supply and demand. While the US is the largest producer and largest consumer, it is not independent of the effects of global aspects of the oil business.
All data from US Energy Information Administration


