An unexpectedly linear magnetic anomaly
Near Silver Star, Montana USA
Apologies if this is too technical, too long, or too anything. My 49-year career was in geologic and tectonic interpretation of gravity and magnetic data, so when a cool new survey comes out in a region where I’ve been on the ground looking at rocks a lot, I can’t pass it up. There won’t be a quiz. And there’s a mineral specimen at the end.
Science is not a collection of established truths (paraphrasing Freeman Dyson), but the pursuit of increasingly accurate information about the universe. We acquire data that we hope will help us in that pursuit, often with specific goals in mind such as finding oil or minerals, understanding earthquake risk, or deciphering the history of the earth.
Sometimes such data yield new questions.
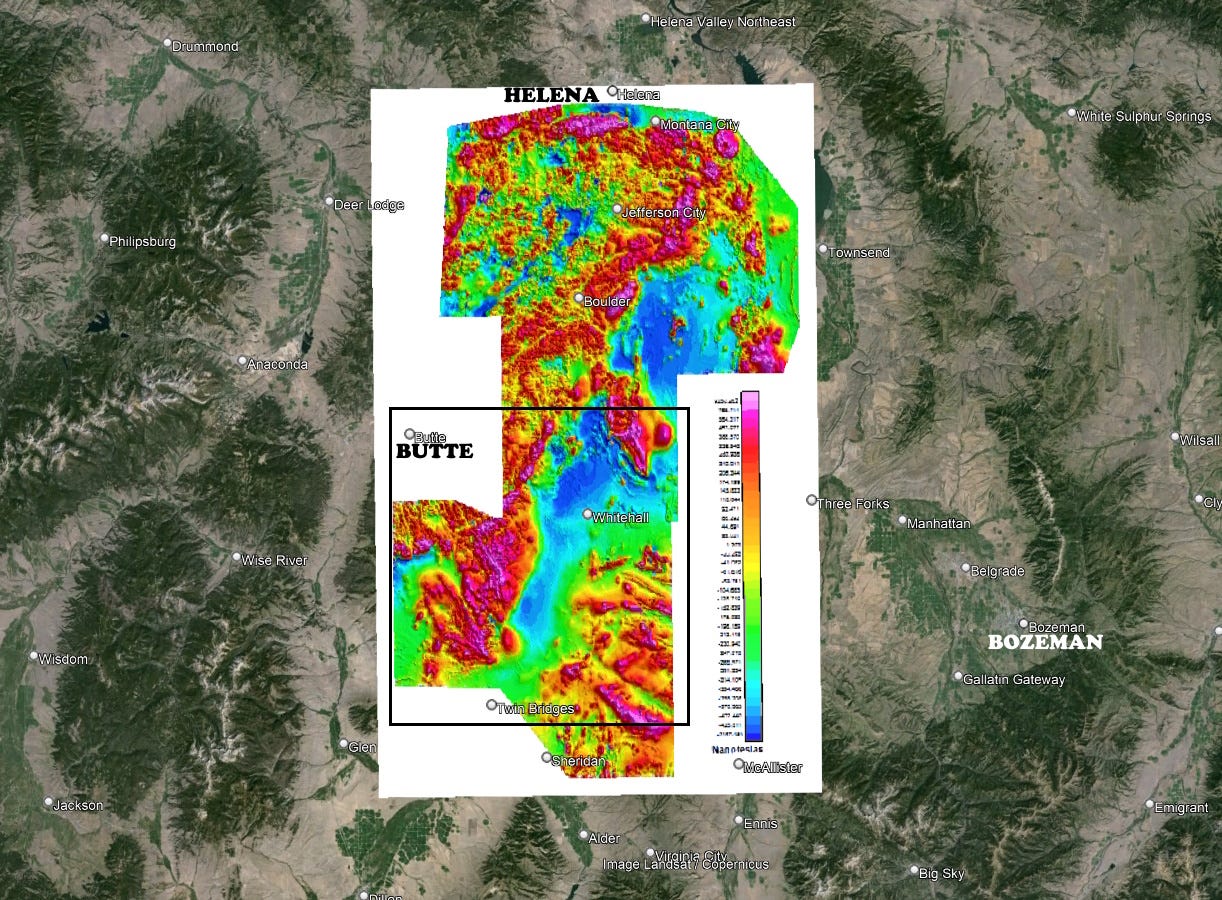
In 2022 the US Geological Survey, with funding from Kennecott Exploration Company (part of Rio Tinto, with an interest in the Madison Copper Gold Project near Silver Star, Montana), acquired an extensive high-resolution aeromagnetic data set in southwestern Montana, intended primarily to address US critical minerals needs under the Earth Mapping Resources Initiative. The entire survey is shown in the map at the top of this post, with a box showing the focus area discussed below.
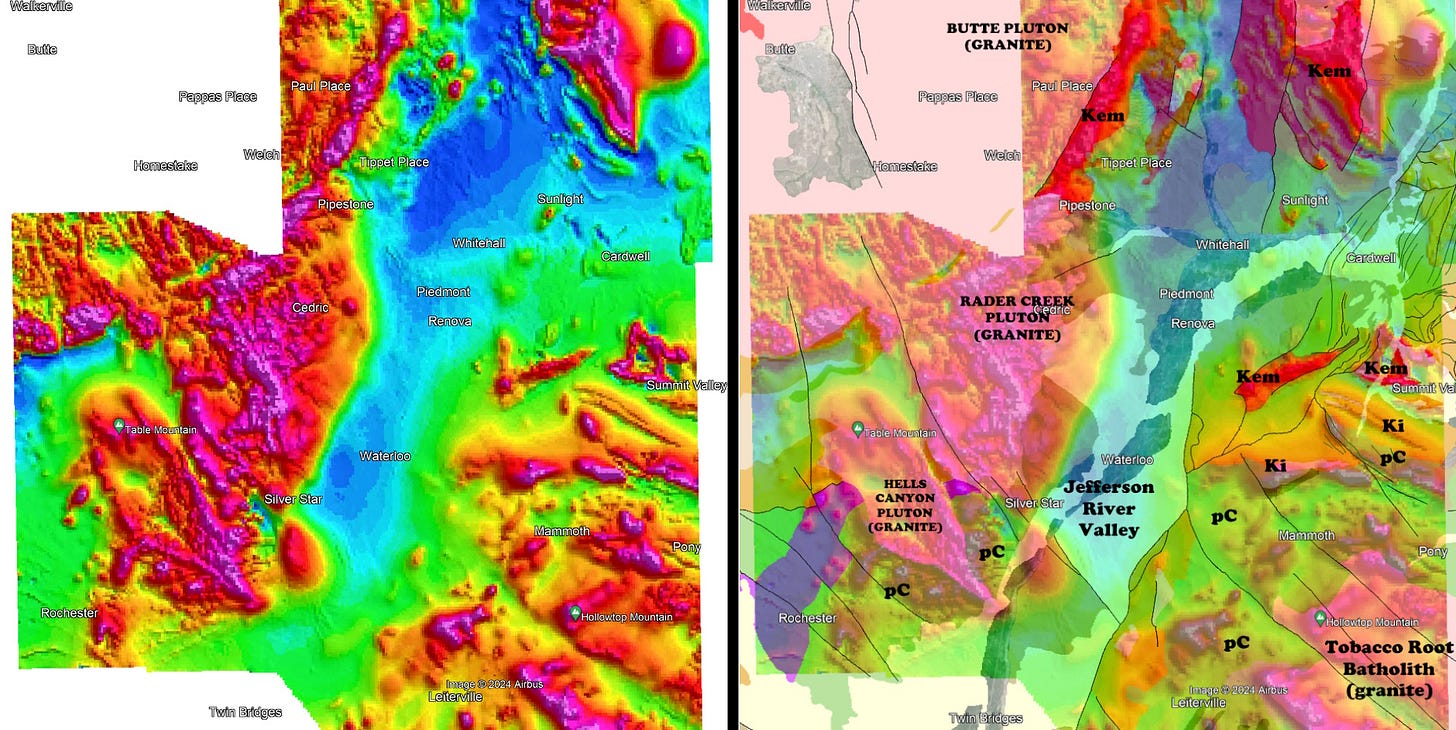
The map above shows a portion of the data extending from the Highland Mountains south of Butte eastward across the Jefferson River valley at Waterloo into the Tobacco Root Mountains.
Much of the information in this display is straightforward and expectable, and correlates well with known surface geology. Magnetic data (with a few exceptions) reflect the magnetite content of rocks, because magnetite is by far the most common magnetic mineral. Consequently, that means the data indicate presence and absence of igneous rocks (usually quite magnetic), metamorphic rocks (quite variable in magnetite content), and sedimentary rocks (usually with very little magnetite). The properties of the magnetic field also allow us to visualize the distance (depth) to those magnetic rocks—narrow, high-frequency features are usually closer to the magnetometer than broad, low-frequency features, whose sources are often deep beneath the ground surface.
Above at right I’ve added faults and the basic geologic map from the Montana Bureau of Mines and Geology’s digital Geologic Map of Montana. I added labels for mapped granite, Precambrian metamorphic rocks (pC), the Elkhorn Mountains Volcanics (Kem), and some major intrusive sills in the northern Tobacco Root Mountains (Ki).
A magnetic low (blue colors) marks the Jefferson River Valley, a down-faulted depression (a graben). The blue colors mean one of two things: either magnetic rocks like those in the Highland Mountains and Tobacco Root Mountains are not present beneath the valley, or if present, their signature is so attenuated that they must lie at great depth. The Jefferson Valley is a relatively linear feature here, as we’d expect from a fault-bounded trough.
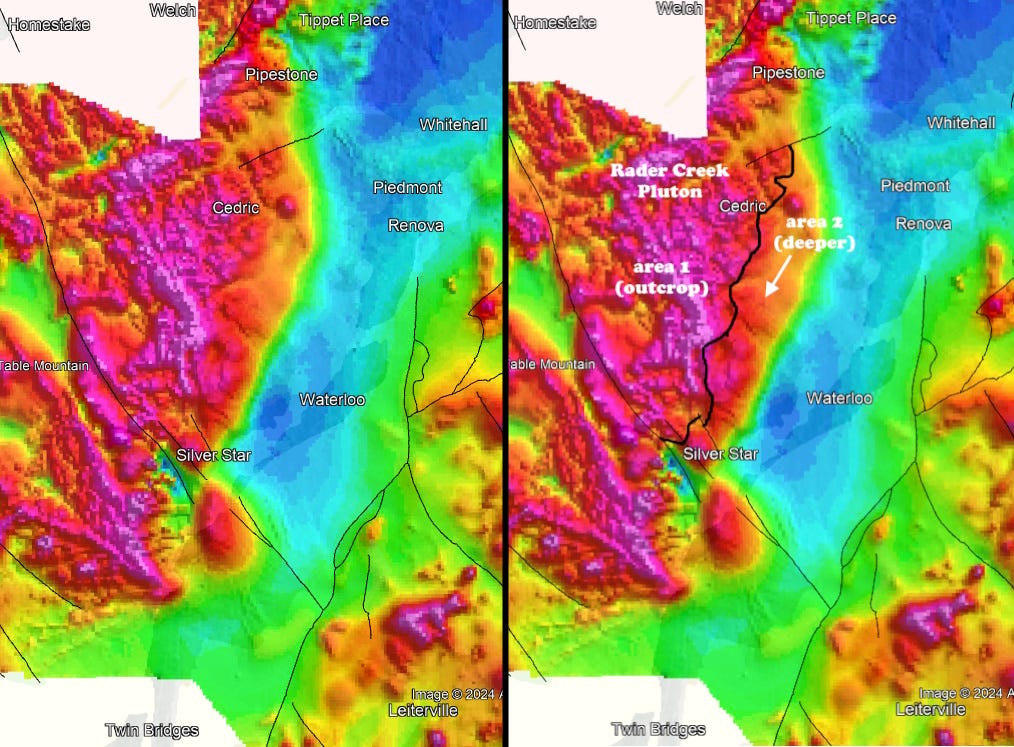
Faults are usually somewhat linear, but depending on the scale, seriously straight lines are unusual in tectonics. The remarkably straight line in the magnetic map, the gradient between a wide red area and the blue of the valley, along the west side of the Jefferson Valley, is somewhat unexpected. In the map at right above, I’ve added a black line to indicate the edge of the outcrop of the Rader Creek granite pluton, both from surface geologic mapping (Montana Bureau of Mines & Geology) and from the character of the magnetic map, in which the narrow, high-frequency, high intensity (red) features (area 1) indicate magnetic rocks at the surface and broader features (area 2) indicate similar rocks at some depth below the sedimentary rocks mapped on the surface.
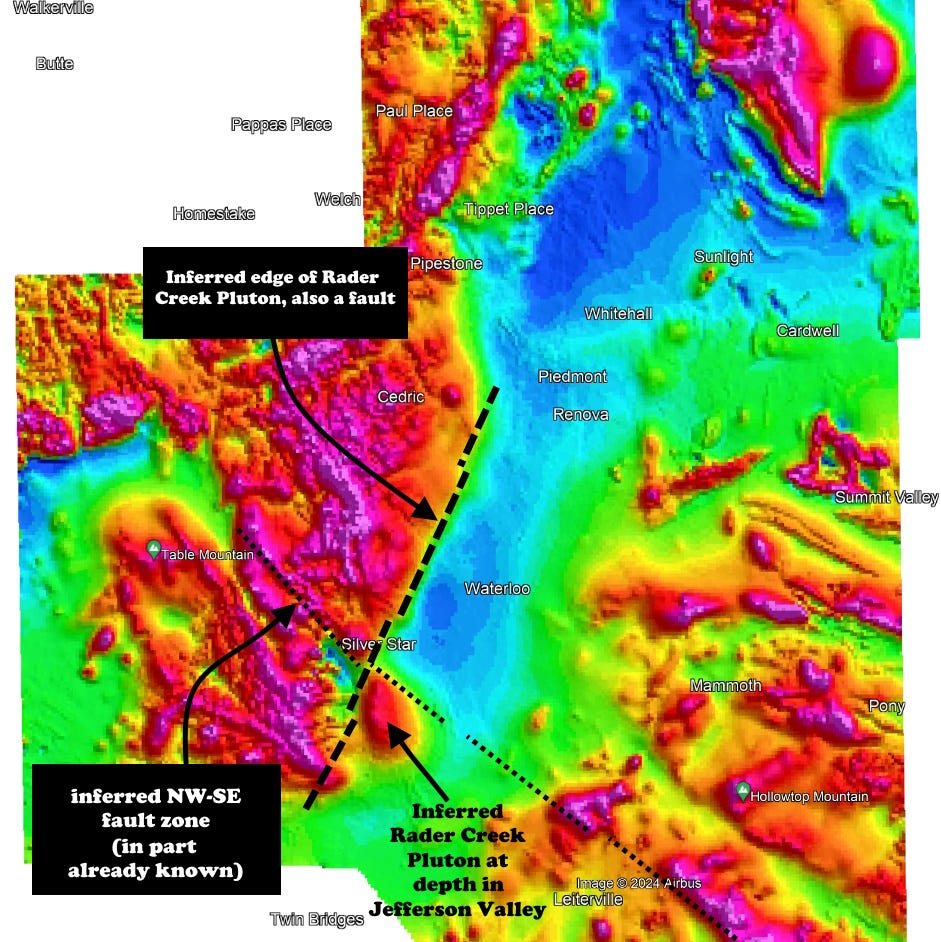
Then we come to the very abrupt linear edge of the red colors. I think there are two choices: the line might mark the literal limit of the magnetic granitic rock of the Rader Creek Pluton in the subsurface (it is certainly not exposed), or it might mark a fault with thousands of feet of offset, dropping the magnetic rocks of the Rader Creek Pluton down to the floor of the Jefferson Valley. The choices are not mutually exclusive, and both could be true.
In fact I think that indeed both are true. I think that linear edge represents the limit of the Rader Creek Pluton in the subsurface, and I think it is a faulted margin. I think it is the limit of the magnetic pluton because if it continued at depth into the Jefferson Valley, there should still be red magnetic features, just much broader (deeper) in their magnetic character, like the broad oval magnetic high in the valley, just south of Silver Star. There are some subtle features in the total magnetic intensity map within the valley that might represent the pluton at depth, but I think they are not (the maps here are reduced to the pole, which is a processing step that removes the effects of the magnetic inclination and declination).
I think that linear gradient is also a fault zone because of the nature of offsets to the south, around Silver Star, which place broad, low-frequency, deeper-source anomalies down into the Jefferson Valley.
There are two choices for the oval magnetic high south of Silver Star. It could represent the southern continuation of the Rader Creek Pluton, dropped down on a northeast-southwest trending fault along that linear gradient described above, and also offset along northwest-southeast trending faults, which are known to exist in the mountains northwest of Silver Star and inferred to the southeast across the Jefferson Valley (Ruppel and others, 1993, Geologic Map of the Dillon Quad: USGS Map I-1803-H). For me the magnetic data support the idea of a fault crossing the valley there (see also Vuke and others, 2004, Geologic map of the Cenozoic deposits of the upper Jefferson Valley: MBMG Open-file Report 505).
The alternative choice is that the oval magnetic high south of Silver Star represents Precambrian metamorphic rocks in that northwest-southeast trending fault zone. I think this is considerably less likely because the character of the magnetic data is unlike most of the expressions of the Precambrian rocks in this area. Whether the rocks are the granite of Rader Creek Pluton or Precambrian, I think the structural interpretation of faulting is the same. It is certainly not an intrusive, plug-like body, because if it were, it would have a distinctively different appearance in the magnetic data.
The point of all this is just to highlight the kinds of information we find and examples of new questions that can arise from new, high-quality data sets. This is certainly a first-look interpretation; the data for this southern part of the survey were just released by the USGS April 22, 2024.
As promised, above is a photo of a 27-cm slab of native copper in skarn from the Madison Gold Skarn at Silver Star, Montana. Collected by and gift from Chris Gammons.
For anyone interested in the USGS data release for this survey, you can find it here.


What a fun job to look at maps for your entire 49 year old career, wow!. This was a very good explanation of these magnetic maps. It would be neat to see the one step further on how you then take this information and make any kind of guess as to where oil or minerals might be, I'm assuming it's the color/presence of magnetite and maybe the shape? Another good explanation Richard thank you.
"Unexpectedly linear magnetic anomaly" okay maybe won't tempt everyone but it certainly made me read on. If your hypothesis is Rader Creek Pluton edge carved away by faulting - could you now see that also in the gravity measurements?