Copper
No. 26 in crustal abundance
Everyone knows copper, but it’s actually less abundant in continental crustal rocks than elements such as chromium, vanadium, zirconium, and strontium (Abundance of Elements in the Earth's Crust and in the Sea, CRC Handbook of Chemistry and Physics, 97th edition (2016–2017), sec. 14, p. 17). It’s more familiar because it occurs as a native element and in compounds that are easy to smelt to get the metal out, so it was used in early civilizations.
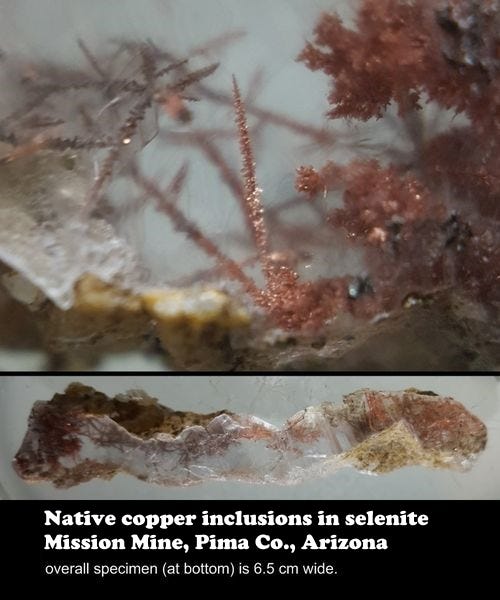
The native copper in the top photo is from a famous (perhaps unique) locality in Arizona where fine spindles and arborescent growths of copper are included in clear selenite (gypsum).
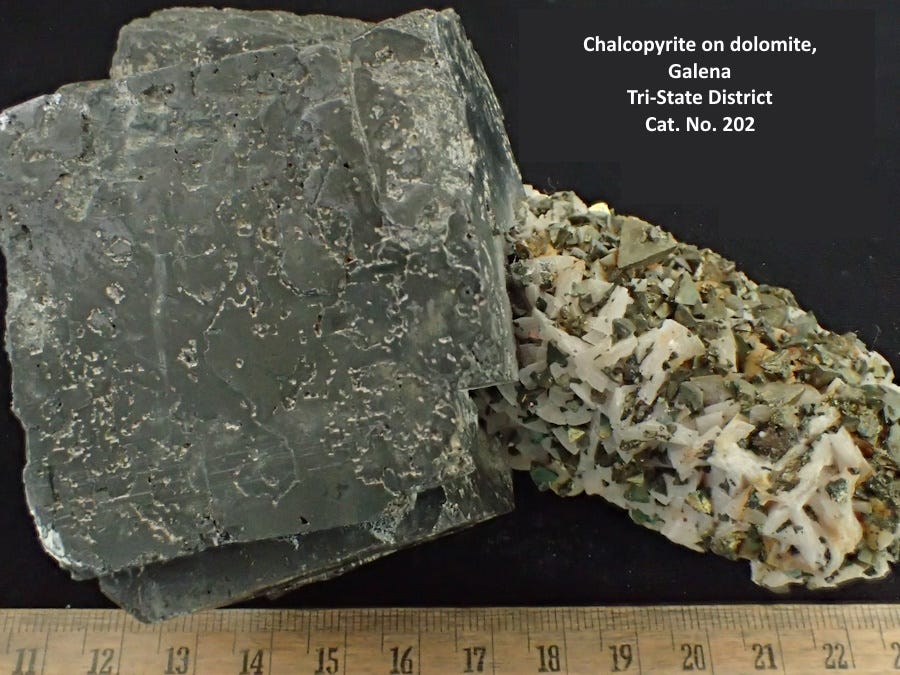
The most abundant source of copper in mining is chalcopyrite, copper-iron sulfide, CuFeS2. The name means “copper pyrite.” The specimen above shows chalcopyrite crystals on dolomite at right, with a huge cube of galena (lead sulfide), from the Tri-State District (Oklahoma-Kansas-Missouri).
Chalcopyrite crystals look like little tetrahedrons, four-sided forms with triangular faces, but they are actually tetragonal disphenoids whose crystal axial parameters are such that the crystals have the appearance of higher isometric symmetry. In the drawings above, the true tetrahedron has uniform measurements in all directions. The tetragonal disphenoid at right has the same number of faces (4) and all are triangles, but not equilateral triangles. But if you squeeze the disphenoid, it can reach proportions very close to those of tetrahedrons. But not quite. Sometimes you see chalcopyrite crystals called “pseudo-tetrahedral.”
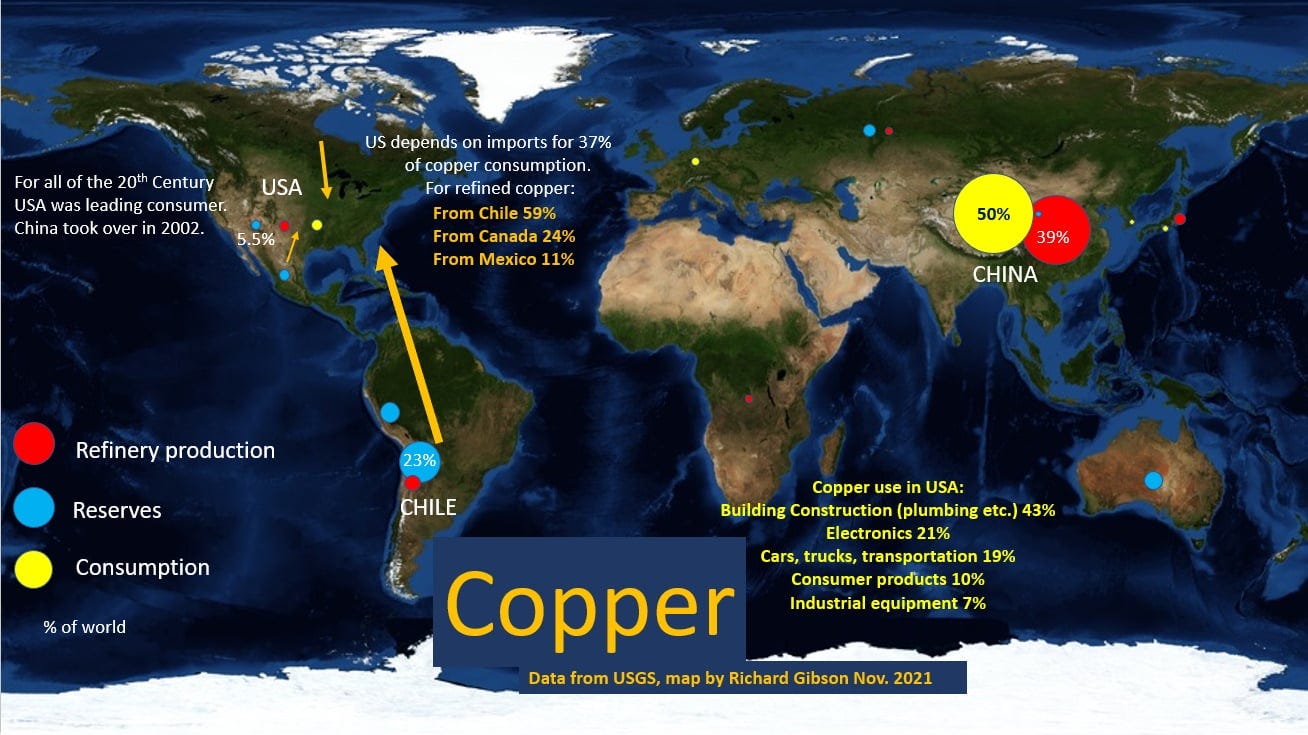
Copper is vital. It’s in your house, your car, your electronic gadgets, your cookware, and more. The United States is dependent on imports for 46% of our consumption, and the US ranks 7th in copper reserves, with about 5% of the estimated world total. I hope this graphic gives some perspective; I made it using 2020 data, and while all the numbers have changed some, probably the most noteworthy is US imports, up to 46% in 2023 vs 37% in 2020. That’s certainly related to a decline in US mine production of copper by about 11% from the 2019-2022 average. In addition to imports and domestic production, about one-third of US copper consumption is based on recycled material. Data source: USGS Mineral Commodity Summaries; updated from information in What Things Are Made Of (2011).
In the US, 70% of copper mine production comes from Arizona. The remaining 30% is from (in decreasing order) Utah, New Mexico, Nevada, Montana, Michigan, and Missouri.


Nice Richard. I acquired one of those arborescent ones some years ago. A nice t/n-almost micro.