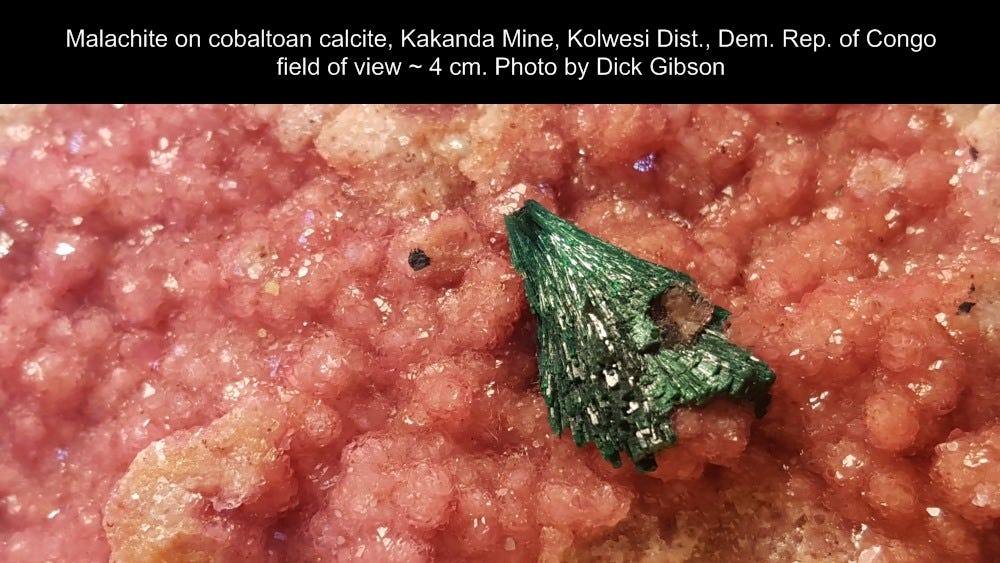
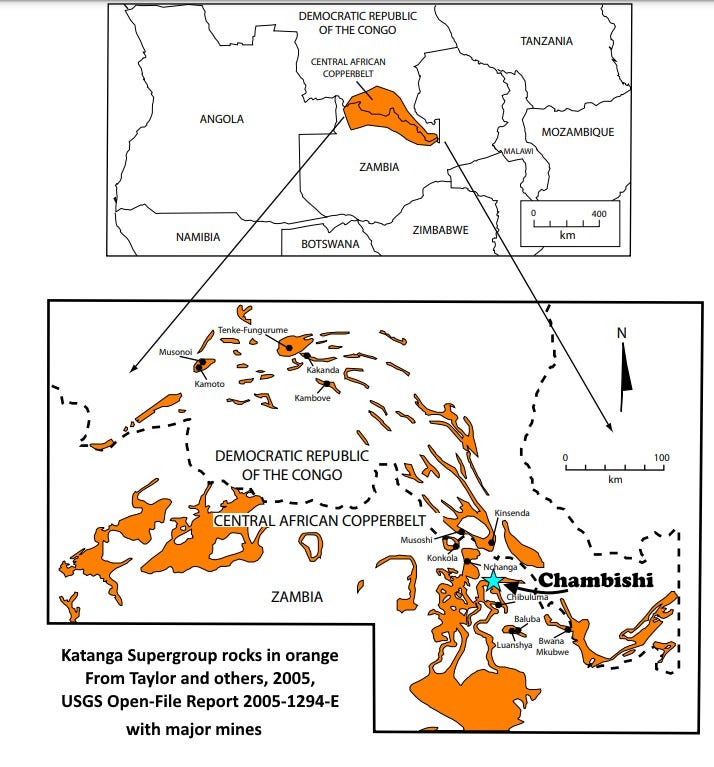
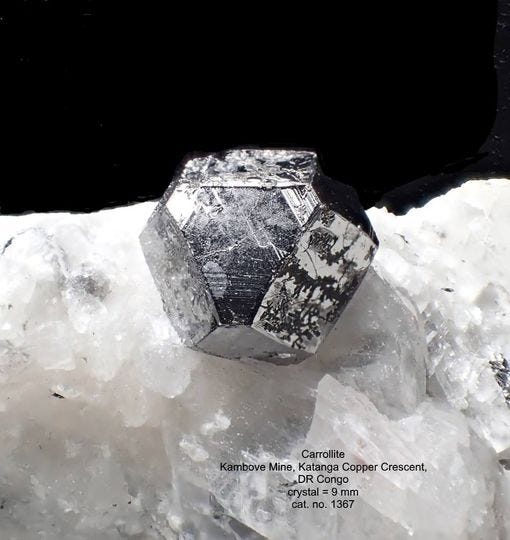
The Zambian Copperbelt and Congo’s Katanga Belt comprise the Central African Copperbelt, one of the richest copper deposits in the world. It is unusual in comparison to other copper regions in being rich in cobalt, with probably half the world’s cobalt.
Zambia’s Chambishi Mine is part of this belt, discovered in 1899, but mining didn’t begin significantly until 1927 when the district was controlled by Cecil Rhodes’s company. That ownership continued until Northern Rhodesia became Zambia in 1964.

Today, many copper producers in southern Africa are owned and operated by Chinese and European companies or in partnership with Zambian companies. China is the largest consumer of copper in the world, taking that spot from the U.S. about 2002. Zambia produces about 760 thousand metric tons of copper a year, ranking it #9 in the world (and 3.5% of total production) after Chile, Peru, Congo, China, the U.S. (which produces about 5% of world copper), and Russia, Indonesia, and Australia.
The copper and cobalt are hosted in sedimentary rocks of the Roan Group (part of the Katanga Supergroup), conglomerates, sandstones, and shales that were deposited in a rift breaking the southern Congo Craton apart about 850 million years ago. Continents rift apart and collide again in cycles spanning on the order of 200-400 million years. In this area, the next collision happened about 550 million years ago, in part of the Pan-African Orogeny (orogeny = mountain building) that was amalgamating the supercontinent of Gondwana. It’s likely that structures and deep copper- and cobalt-bearing brines from that time were the origin of the mineralization in the Katanga Copper Belt. For more information, see Zientek and others, 2014, Sediment-hosted stratabound copper assessment of the Neoproterozoic Roan Group, Central African Copperbelt, Katanga Basin, Democratic Republic of the Congo and Zambia: U.S. Geological Survey Scientific Investigations Report 2010–5090–T, 162 p.
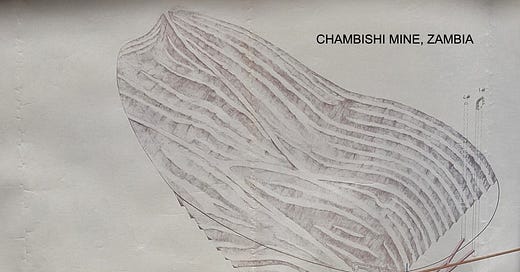
Open pit mining began at Chambishi in 1965. The drawing at top, by C.A. Redman, shows both the pit and the older (and continuing) underground mine situation. It was probably made sometime in the 1970s. I got it at the Colorado School of Mines book sale in the mid-1990s for ten cents. (Yes, I’m a sucker for cool old maps, especially when they’re practically free. I came out of that CSM sale with $10 worth of maps at 10 cents each.)
The Chambishi Mine is controlled (90%) by the Eurasian Resources Group (ERC) headquartered in Luxembourg, but whose major shareholders include the government of Kazakhstan (40%) and three Kazakh billionaires with multi-nation citizenship. You may or may not have heard of ERC, but they have at least 69,000 employees and operate mining and related operations around the world. The other 10% of Chambishi is owned by the government of Zambia.
Chambishi means "place of zebras" in the local Lamba language.
Chambishi’s cobalt production is enough to support a local smelter there in addition to the copper operations. Global cobalt hasn’t changed much since I made the infographic above in 2019. Not much changed in production and imports between 2017 and 2023 (the latest data reporting year); imports from Canada were up some, and imports from Russia, Australia, and China were down.
US imports overall were a little lower, 67% of consumption in 2023 vs 78% in 2019, while US production (about 500 tons out of 8,300 tons consumed; most US mine production is from a mine in Michigan where it is a by-product of nickel mining) declined about 14% in concert with a consumption decline of about the same amount. US cobalt reserves are less than 1% of known cobalt worldwide. 25% of US cobalt consumption comes from recycling, although some of that comes from purchased and imported scrap.
The big deal is the price. Between 2018 and 2023, the price of cobalt fell by at least 64%, and despite a rise in 2022, the price in 2023 was about 55% lower than it was a year earlier.
The price crash appears to be driven by straightforward supply and demand issues: expected demand increases to support a surge in electric vehicle production that did not materialize, plus oversupply from Congo, which in 2023 provided around 74% of world cobalt production, much of it reportedly the result of child labor, together with other humanitarian issues. Although the United States does not import cobalt from Congo directly, it certainly ends up with some via refiners and exporters in places like China.


