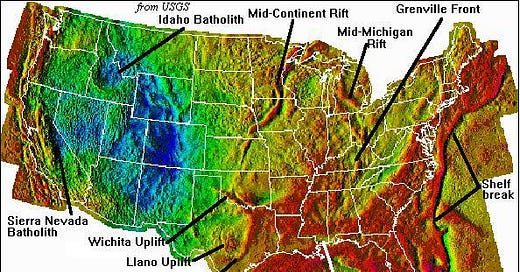
This gravity map of the conterminous United States (from the USGS) shows the kinds of information present at even really small scales covering vast areas. Even in areas like lower Michigan, Iowa, Kansas, and Texas, where the surface may be relatively flat and uninformative in terms of the deeper rocks and their tectonics, you can see things that reveal earlier geologic history.
The Mid-Continent and Mid-Michigan rifts date back to about 1.1 billion years ago when North America was being pulled apart – but those rifts failed, even though they became somewhat filled with basalt that is now expressed in this map as linear gravity highs, the result of the contrast between dense basalt and adjacent less-dense rocks.
The blue colors (gravity lows) in the Sierra Nevada and Idaho Batholiths represent those granitic rocks, low in density compared to denser mantle into which the granite extends. Likewise, the huge gravity low in Colorado and adjacent states is partly indicative of thickened lower-density crust, a result of the collisions and thickening that built the Rocky Mountains. They aren’t just high surface uplifts, they also extend down into the earth more than “normal” continental crust — the “roots” of the mountains. The batholith intrusions and the Rocky Mountains more or less date to the Mesozoic Era, broadly about 180 to 55 million years ago, much younger than the Mid-Continent Rift.
The curving gravity high labeled “Ouachita Inner Metamorphic Belt” is dense rocks in the subsurface of Texas that were formed during the collisions that produced the Appalachian and Ouachita Mountains, in the time frame of 400 to 250 million years ago. The Llano Uplift, inboard from this zone, served as a broad buttress guiding the overall geometry of the collision belt.
The prominent linear feature offshore from the east coast is the strong density contrast between rock and water along the shelf break, where the shallow water of the continental shelf abruptly becomes deeper. The edge follows the modern bathymetry, but it has a heritage dating to the initiation of the North Atlantic Ocean in Jurassic time, about 170 million years ago.
All the values, represented as colors, reflect the contrast in density between different packages of rocks (or rock and water, offshore).
Generally speaking, on a map of this scale the broad features to a first approximation represent variations in crustal thickness, and the contrast between the earth’s crust and the denser mantle. Narrower features indicate significant sub-regional changes in rock type that in turn reflect differences in density. You’d need a much larger-scale map to “see” things like salt domes, smaller fault blocks, and such, and you’d actually filter out most of the things you see at the scale of the US map.
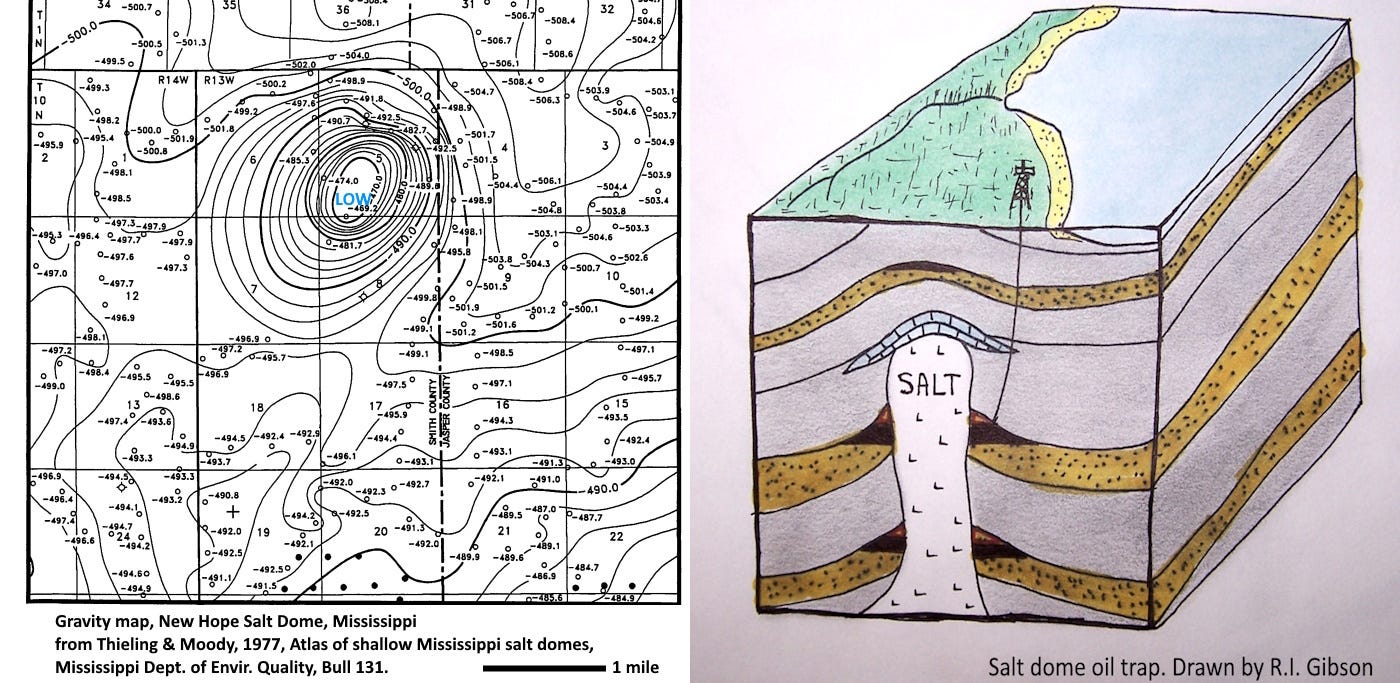
The map above shows a gravity map of a salt dome in Mississippi, at a place where there is no evidence on the surface of what lies beneath. The sharp gravity low defines the subsurface salt dome very well, an expression of the low density of the column of salt compared to the surrounding, denser rocks, but such a feature is far too narrow to show up in the map of the US at the top of this post. The cartoon cross section and block model at right illustrates how such a salt dome might penetrate the other rocks and tilt them so that they might trap oil. In the 1930s, Gulf Oil discovered more than 20 little oil fields related to salt domes like this by making measurements of the gravity field in Mississippi (Gibson, 1998, Mississippi Salt Basin: in Geologic Applications of Gravity and Magnetics: Case Histories: SEG Geoph. Ref. Series 8, AAPG Studies in Geology 43, Gibson & Millegan, eds., p. 72).


